More Output, Less Progress?
Real alignment is now our biggest challenge
This post was also published at manager.dev. Written in collaboration with Anton Zaides.
A couple of months ago, a Staff engineer in my team told me: “We seem to be going backwards in how we manage projects”. He was working on a project that was stuck.
- The engineers felt blocked because design wouldn’t provide enough direction.
- The designers felt they were being rushed to deliver suboptimal work.
- The product manager was in the middle trying to coordinate a path but also struggling to keep up with all the possibilities.
The situation escalated to me and my peers in design and product management. We couldn’t agree either: there were lots of opinions and not many facts. We were now in a six-person asynchronous discussion, going in circles. And this problem wasn’t unique to this project.
We can now deliver output in many areas much faster than before. Prototypes are easy to build, code is easier to write, testing is easy to execute. But all that extra output comes with extra noise:
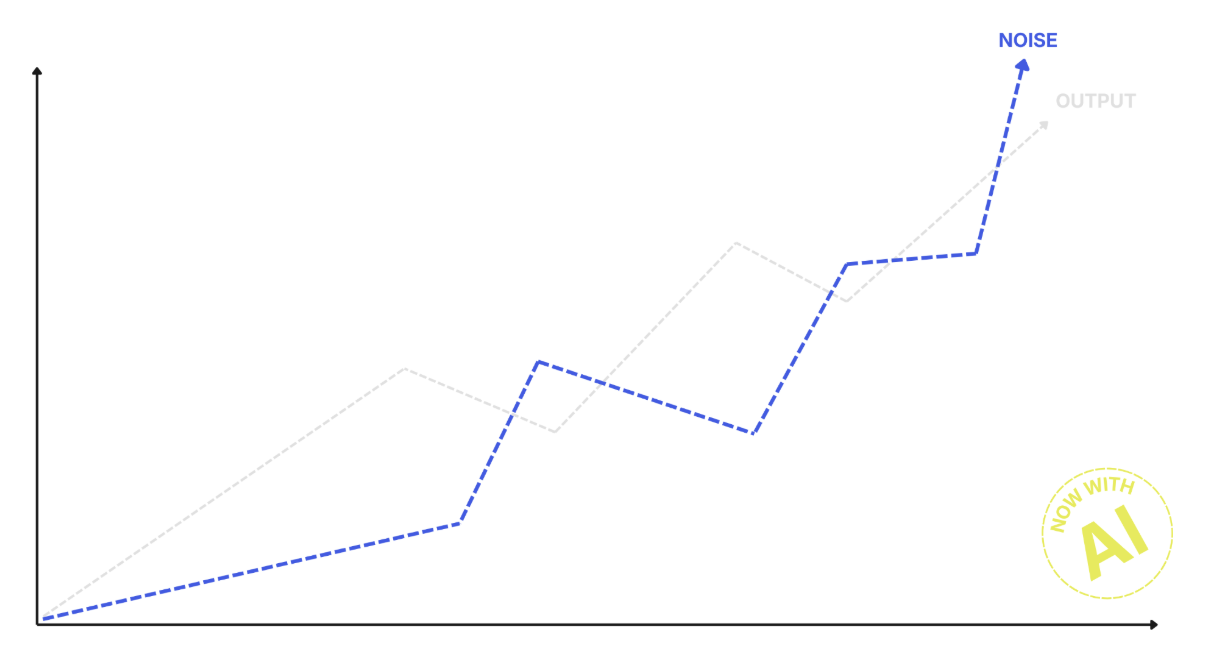 Output has increased, and so has confusion.
As an industry, we are building a lot of great tools to align agents. There are new harnesses coming out every week. However, we don’t seem to be spending much time discussing how to better align people in the new context. And the people are the ones driving the agents.
Take technical design documents for example. Before AI, design documents were the way to align a team around how a feature or solution would be implemented. They would bring opinions together and drive the group toward a common vision.
Design documents were far from perfect as an alignment tool, but they were good enough. With AI, we now have very long documents generated by agents that not many people can read and even fewer understand. Instead of aligning the group, they became a tool to disengage engineers from a conversation, making the process less effective.
“Here is my perspective, in a twenty-page document (A)I just wrote”
- Your colleague.
The challenge with AI is that we are often optimizing the parts, without looking at the whole.
We speed up code delivery but don’t think about how that affects reviews. We speed up prototyping but don’t think about how we are going to decide amongst all of the options. That’s exactly what was happening in our project: there was a lot of output from everyone, but no agreement.
Draw it instead of debating it
To solve it, we used a simple tool that has always been useful in this situation and continues to be: visualizations.
Information radiators, the big shared displays a whole team looks at (like everyone’s agile board), have always been a way to bring perspectives together, and they matter even more as complexity grows. Documents got longer and more confusing, but a visual can be understood within a few seconds.
We kept discussing in circles until we decided to get together and map the project timeline: what had happened, and when? We built it from documents, Slack conversations, Jira tickets, and code commits:
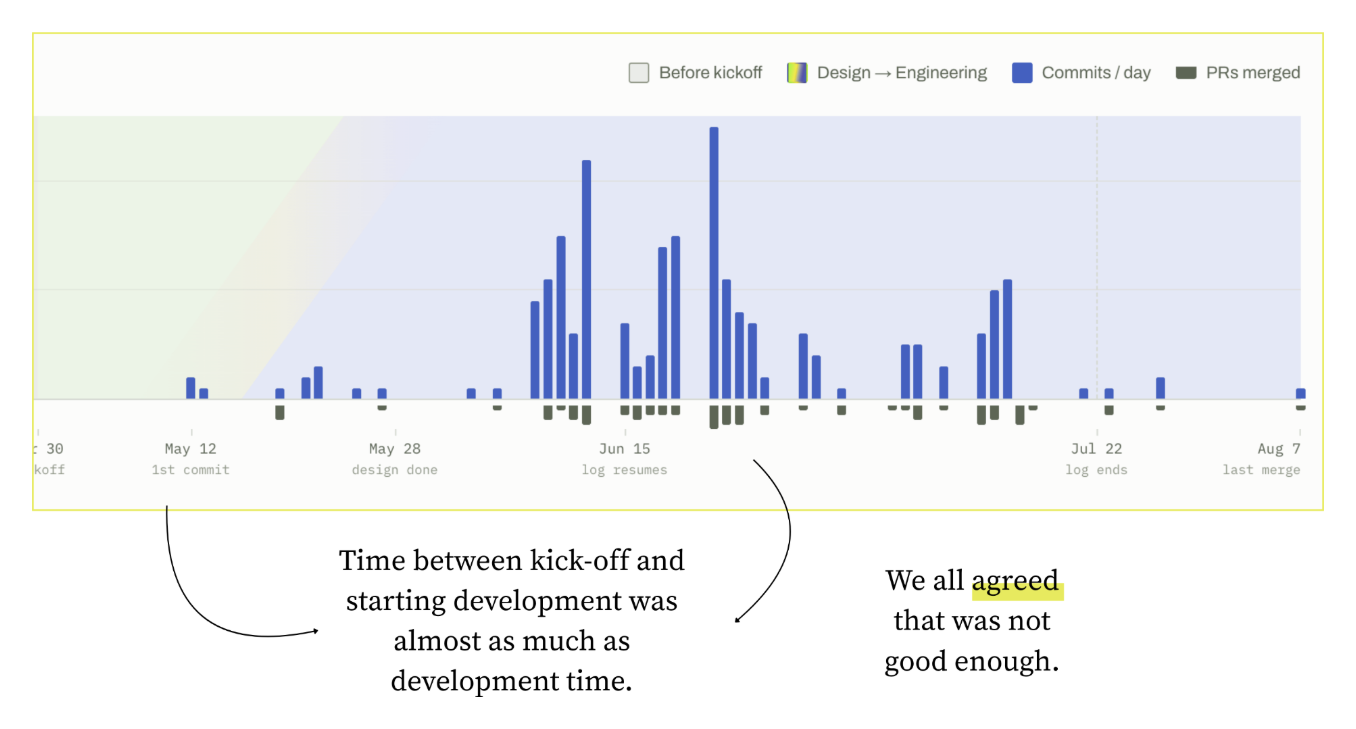 A project timeline is a simple way to get great insights on what is actually happening.
When we did, the alignment came almost naturally.
It had taken us a month to plan the project and a month to write the code for it, and we all agreed that was not the right balance. The design leaders agreed we should iterate faster, but we also all saw that the team was not collaborating closely across disciplines. That gap matters much more in the AI era: a few weeks of planning was noise when execution took months, but it’s a major bottleneck when building can take days.
The timeline also put the blame where it belonged: on a broken process, not on people. It was now easier to get agreement since we were all discussing based on a shared reality instead of a lot of competing opinions. With the problems clear, it was much easier to align on the solutions.
- Don’t wait for final designs. The timeline showed we were spending a long time planning before development started, so we agreed that designs didn’t need to be final before engineering work began. Before AI, that would have meant a lot of rework for engineers. Today, that rework is much cheaper. It also gave designers room to finish their work in the time they needed, without blocking engineers.
- Kick off together. The chart also made it obvious that the team was working sequentially: product defines the requirements, then design creates the visuals, then engineers build them. None of us wanted to work that way. So we changed the kickoff: the product manager, design lead and engineering lead now finalize the requirements document together, forcing the cross-functional collaboration to start from the beginning of each initiative.
Both changes made the next project much smoother, with the team moving faster in planning and in execution.
None of this was a new concept. Iterative product development is what everyone involved was aspiring to in theory, as a ‘best practice’. But this is an example of how the practice can drift far away from the theory as everything is moving faster. People become busy and distracted, and it becomes easy to miss the forest for the trees.
The same principle improved the design documents problem from earlier. We defined a stronger rubric for technical documents, built around one goal: an informed discussion and a shared understanding among engineers. Docs are now shorter and higher level, and use architecture diagrams to explain the end-to-end system instead of twenty pages of implementation details. The rubric works for AI-written docs too, and our documents are now far easier to read (and understand!).
Try it on your team
A huge benefit of AI is that it makes this type of analysis much easier to achieve. Our chart took a few prompts and a few hours of fact checking (it was mostly right). The data is already sitting in the tools your team uses every day.
Pick a project your team recently delivered and build its timeline, from the first time it was discussed until it reached production. Pull in the docs, Slack threads, tickets and commits, ask an LLM to lay out what happened when, then fact-check it with the people involved. If you haven’t done this before, I guarantee you’ll find it interesting.

Comments